l.p <- c("terra", "sf", "fields", "ranger", "ggplot2") # optional: "mapview"
install.packages(l.p)28 Lab: Spatial sampling
Download R Code
28.1 Create sampling design for training
In this section we will create a Feature Coverage Sampling Design for the La Réunion dataset.
Installation and data download
Install required R packages
Download dataset
This zip contains a folder terrain with derivatives from the elevation model and folder soil with a map of soil organic carbon stocks extracted from the global overview soil map SoilGrids.
Unpack the folder into a folder called datasets.
Prepare data
Read in data and check content
library(terra)
library(sf)
library(fields)

# set working directory to folder above "data"
r.dem <- rast("datasets/lareunion/data/terrain/reunion_30m.tif")
r.dem
class : SpatRaster
size : 769, 667, 1 (nrow, ncol, nlyr)
resolution : 30, 30 (x, y)
extent : 330000, 350010, 7669992, 7693062 (xmin, xmax, ymin, ymax)
coord. ref. : WGS 84 / UTM zone 40S (EPSG:32740)
source : reunion_30m.tif
name : reunion_30m
min value : -3.551687
max value : 2274.301270 Create first display
plot(r.dem)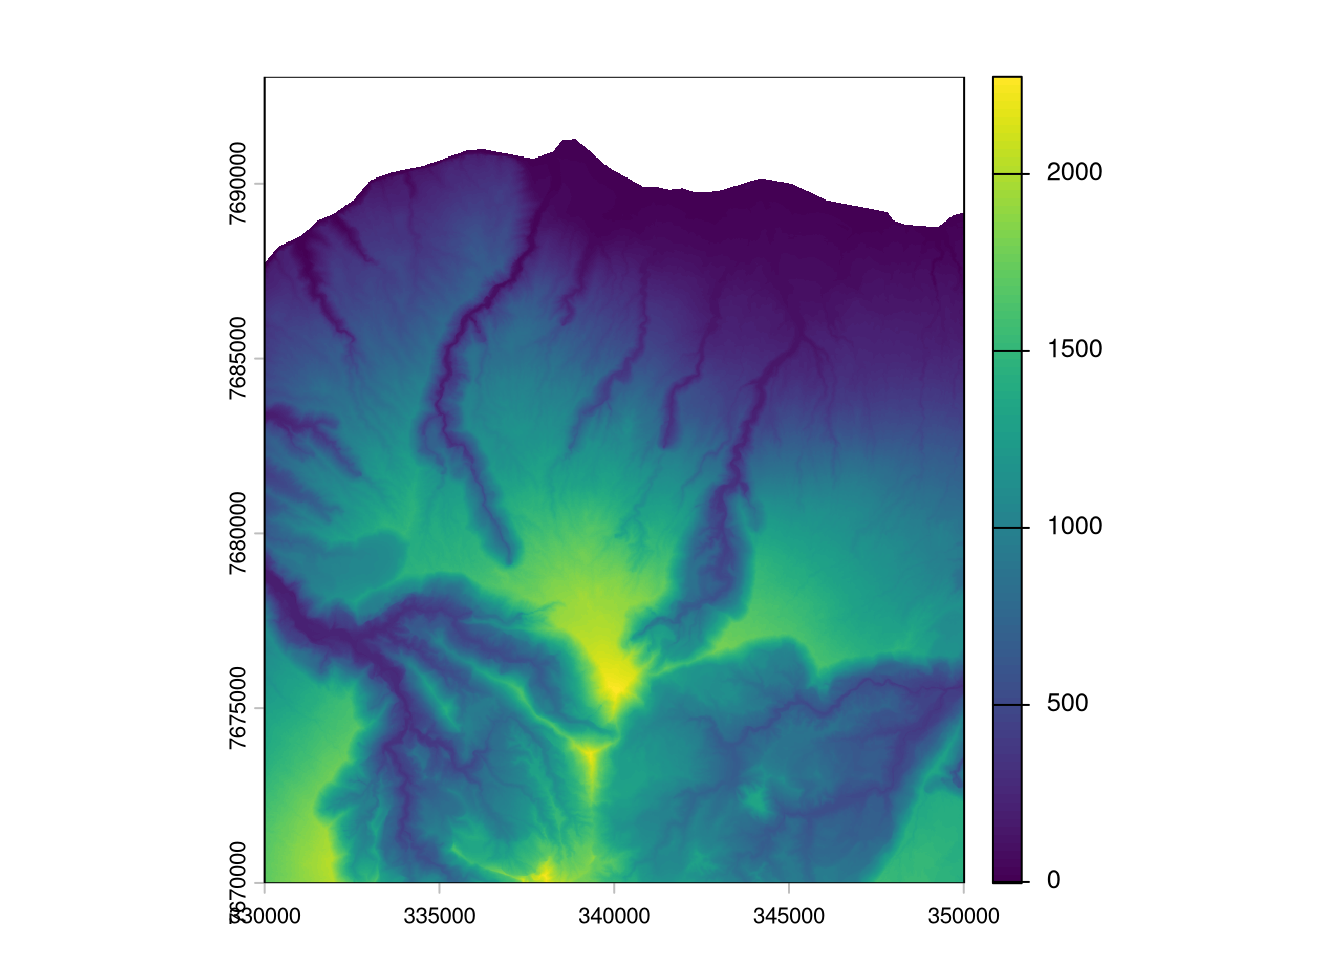
Select variables for sampling design and transform into data.frame
For now we decided to use elevation (reunion_30m.tif), slope computed on 100 by 100 m pixels (slope100m-perc.tif) and a topographic position index calculated at 900 m diameter (tpi_900m.tif).
# create a list of file names
l.rast <- paste0("datasets/lareunion/data/terrain/", c("reunion_30m.tif", "slope100m-perc.tif", "tpi_900m.tif"))

# create a raster stack
r.stack <- rast(l.rast)

# create a data frame, each row corresponds to a pixel
d.pixels <- as.data.frame(r.stack, xy = T, na.rm = F)
str(d.pixels)
'data.frame': 512923 obs. of 5 variables:
$ x : num 330015 330045 330075 330105 330135 ...
$ y : num 7693047 7693047 7693047 7693047 7693047 ...
$ reunion_30m : num NA NA NA NA NA NA NA NA NA NA ...
$ slope100m-perc: num NA NA NA NA NA NA NA NA NA NA ...
$ tpi_900m : num NA NA NA NA NA NA NA NA NA NA ...Select relevant pixels
To reduce computational load and ensure a minimal distance between sampling points we use every second pixel (60 m distance).
# only use every second pixel, ensures 60 m distance between sampling points
t.sel.x <- d.pixels$x %in% seq(min(d.pixels$x), max(d.pixels$x), by = res(r.stack)[1]*2)
t.sel.y <- d.pixels$y %in% seq(min(d.pixels$y), max(d.pixels$y), by = res(r.stack)[1]*2)

# remove NA, and remove every second pixel
d.pixels <- d.pixels[ complete.cases(d.pixels) & t.sel.x & t.sel.y, ]

str(d.pixels)
'data.frame': 102777 obs. of 5 variables:
$ x : num 338655 338715 338775 338835 338655 ...
$ y : num 7690707 7690707 7690707 7690707 7690647 ...
$ reunion_30m : num 19.7 18.8 18.3 17.4 21.9 ...
$ slope100m-perc: num 0.0443 0.0448 0.0439 0.041 0.0477 ...
$ tpi_900m : num 2.81 2.02 1.76 2.21 2.9 ...k-means clustering
Form as many clusters as we like to have samples. For the clusering we use the 3 variables defined above, but also the spatial coordinates to ensure equal spatial coverage.
# scale variables and round to 5 digits to make clustering more stable
d.pixels.sc <- round(scale(d.pixels), 5)

# set seed for reproducibility
set.seed(11)
# k-means clustering, with centers = numbers of samples to plan
m.kmeans <- kmeans(d.pixels.sc, centers = 150, iter.max = 50)

# number of pixels per cluster
m.kmeans$size
[1] 334 634 385 971 406 249 444 483 479 601 451 1090 893 578 952
[16] 517 769 197 624 704 1001 590 510 682 673 949 652 933 308 668
[31] 461 796 431 742 849 809 509 473 678 1172 506 1132 1032 1409 739
[46] 439 652 467 831 534 545 415 808 276 420 882 191 851 778 1579
[61] 709 634 717 931 1625 333 411 815 436 579 622 821 1033 399 973
[76] 788 511 445 358 661 521 1150 467 513 1142 620 900 397 770 706
[91] 629 408 694 296 499 737 1006 904 427 603 573 1284 702 544 1179
[106] 913 437 1015 764 835 532 658 826 620 1409 1036 883 797 314 512
[121] 520 799 363 1001 694 1222 605 471 605 825 1026 202 362 567 463
[136] 898 447 955 435 1195 719 367 705 593 991 892 293 875 385 146Select sampling point
Select pixel that is closest to cluster center (cluster center is a calculated mean).
# extract real points closest to cluster center
m.dist <- rdist(d.pixels.sc, m.kmeans$centers)
# select row indices
idx <- apply(m.dist, 2, which.min)

d.sample <- d.pixels[idx, 1:2]

# create sample IDs
d.sample$id <- paste0("train_", 1:nrow(d.sample))

# create a spatial points object and save to Geopackage
v.sample <- st_as_sf(d.sample, coords = c("x", "y"), crs = 32740)
write_sf(v.sample, "datasets/lareunion/results/fsc_design_150.gpkg")

v.sample
Simple feature collection with 150 features and 1 field
Geometry type: POINT
Dimension: XY
Bounding box: xmin: 330675 ymin: 7671147 xmax: 349335 ymax: 7689387
Projected CRS: WGS 84 / UTM zone 40S
First 10 features:
id geometry
357815 train_1 POINT (339075 7676967)
273509 train_2 POINT (331155 7680747)
177921 train_3 POINT (344955 7685067)
404519 train_4 POINT (339495 7674867)
261875 train_5 POINT (342315 7681287)
343079 train_6 POINT (337215 7677627)
188259 train_7 POINT (334935 7684587)
251163 train_8 POINT (341115 7681767)
360439 train_9 POINT (337755 7676847)
452723 train_10 POINT (344895 7672707)Display created sampling points
library(mapview)
mapviewOptions(basemaps = c("OpenStreetMap", "OpenTopoMap", "Esri.WorldImagery")) # default map requires an API key
mapview(v.sample)
Create a map of cluster zones
Create predictions of clustered areas.
# extract cluster for each pixel
d.pixels$clusters <- fitted(m.kmeans, "classes")
# create a raster object
r.clusters <- rast(d.pixels[, c("x", "y", "clusters")], type="xyz", crs= "epsg:32740")
writeRaster(r.clusters, filename = "datasets/lareunion/results/fsc_design_150_clusters.tif", overwrite = T)
plot(r.clusters)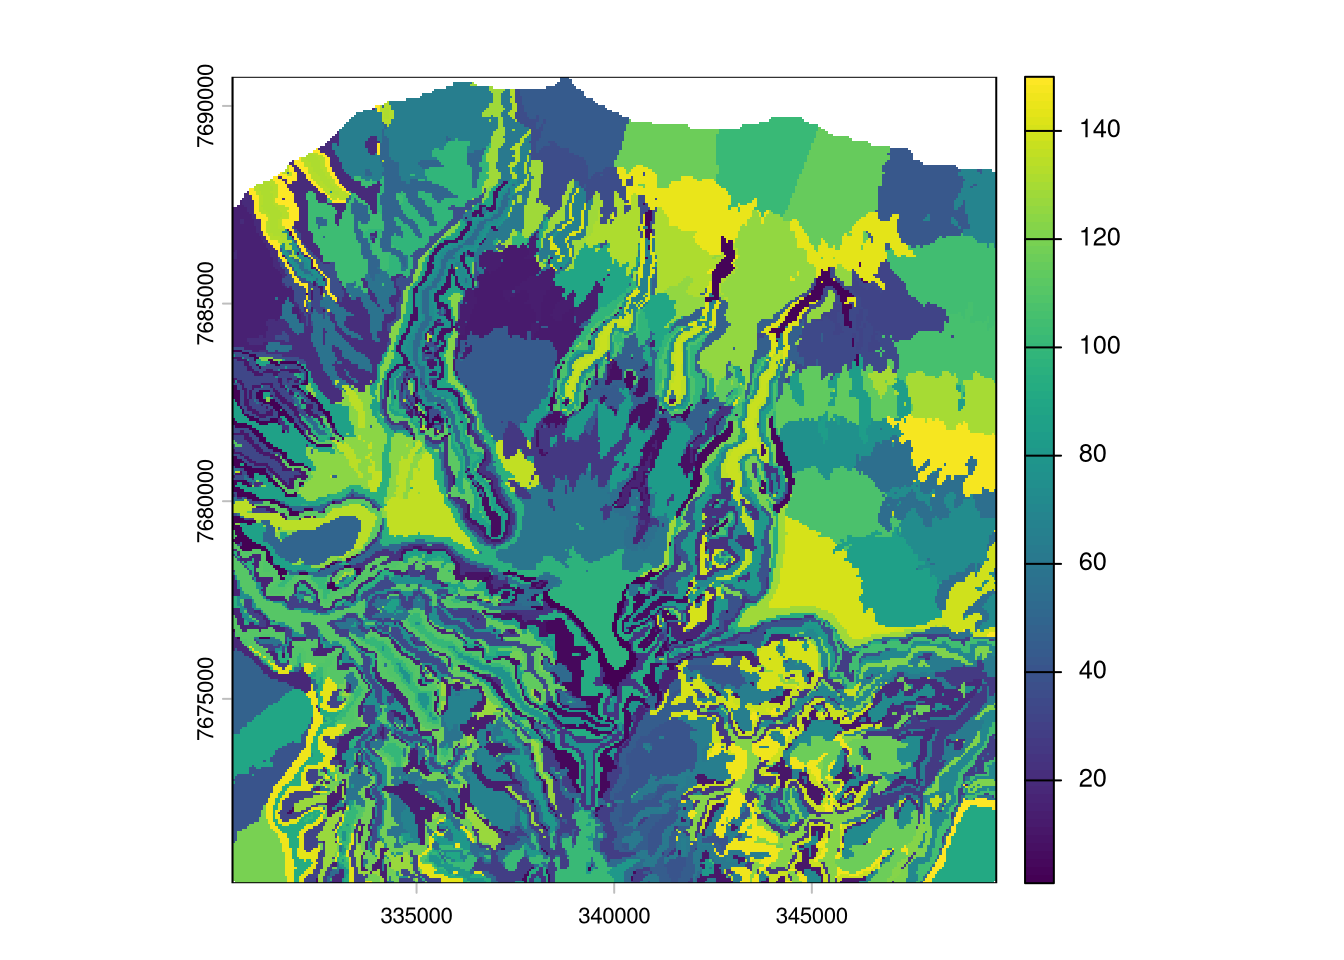
Tasks
TipTask 1
Display the created sampling points and cluster zones in QGis. Also add background map. Verify your result. Would you pass it to the surveyors? Or what would you improve?
TipTask 2
Remove the spatial coordinates from the clustering. Do you see a difference and why?
TipTask 3
Change other criteria such as the number of sampling points or chose other variables for the clustering. Observe the changes and compare with how you would manually place sampling points on a map.
28.2 Create sampling for map validation
Now we create a stratified random sample to estimate the map error.
Form strata
As we have no further information on the distribution of the map errors we assume elevation is a relevant factor. We plan 30 sampling points and from 3 strata, thus 10 random points per stratum.
# use elevation as strata, from 3 strata
t.breaks <- quantile(d.pixels$reunion_30m, probs = seq(0,1,1/3))
d.pixels$strata <- cut(d.pixels$reunion_30m, breaks = t.breaks, labels = 1:3)

# check if it worked
table(d.pixels$strata)
    1     2     3
34258 34259 34259
Plot maps of strata
# save strata map
r.strata <- classify(r.stack[[1]], rcl = t.breaks)
writeRaster(r.strata, filename = "datasets/lareunion/results/strs_design_3_strata.tif", overwrite = T)

plot(r.strata)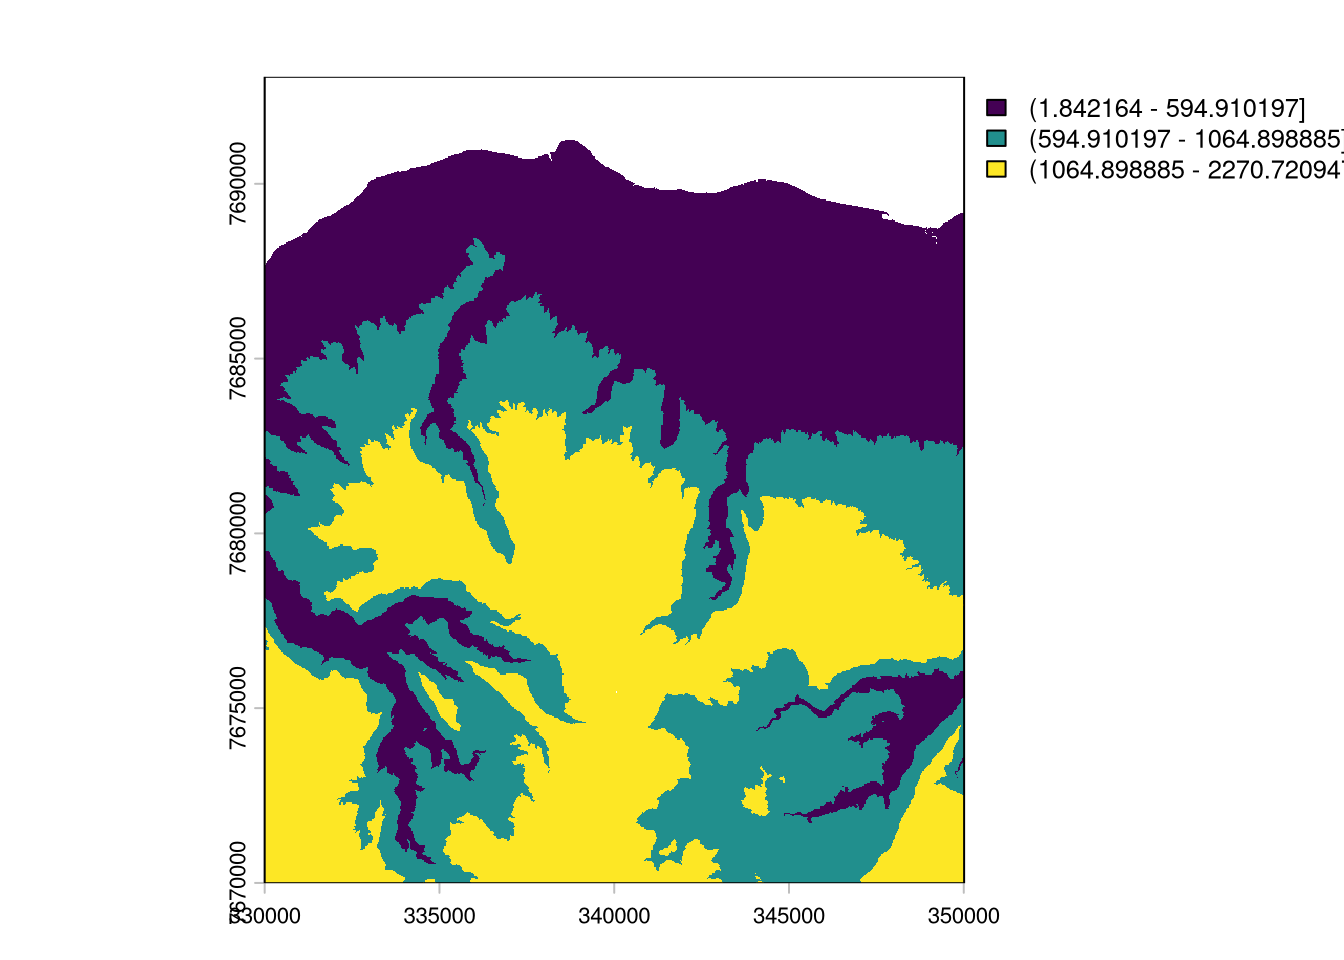
Select random samples per stratum
set.seed(1)

# apply random selection of 10 points for each strata
l.sample.rows <- lapply(c("1", "2", "3"), function(stratum){
  # select relevant row names
  l.row <- rownames(d.pixels[ d.pixels$strata == stratum, ])
  # randomly select 10 of the row names
  l.rs <- sample(l.row, 10)
  return(l.rs)
})

# select corresponding pixel
d.sample <- d.pixels[ unlist(l.sample.rows), ]

# check if number per strata are ok
table(d.sample$strata)
 1  2  3
10 10 10
# create sample IDs
d.sample$id <- paste0("val_", 1:nrow(d.sample))
v.validation <- st_as_sf(d.sample[, c(1:2,5)], coords = c("x", "y"), crs = 32740)
write_sf(v.validation, "datasets/lareunion/results/strs_design_30.gpkg")Display results
mapview(v.validation)Tasks
TipTask 1
Is the distribution of point locations as you would expect it? Change the seed. What happens?
TipTask 2
The Horvitz-Thompson estimator has not been used in this section. Does it apply to this case? Where does it need to be applied?
TipTask 3
Create strata that have equal area coverage. For this create a k-means clustering (with e.g. k = 3) just using the coordinates. For each clustered zone again take a random sample.
28.3 Use sampling designs for mapping
Soil map (instead of real sampling)
In this section we use the created sampling desings to create a map of soil organic stocks and to validate map accuracy. We imitate real sampling by reading out values from the global overview soil map SoilGrids.
r.soc <- rast("datasets/lareunion/data/soil/soilgrids_SOCstock_0-30_mean30mSmooth.tif")
plot(r.soc)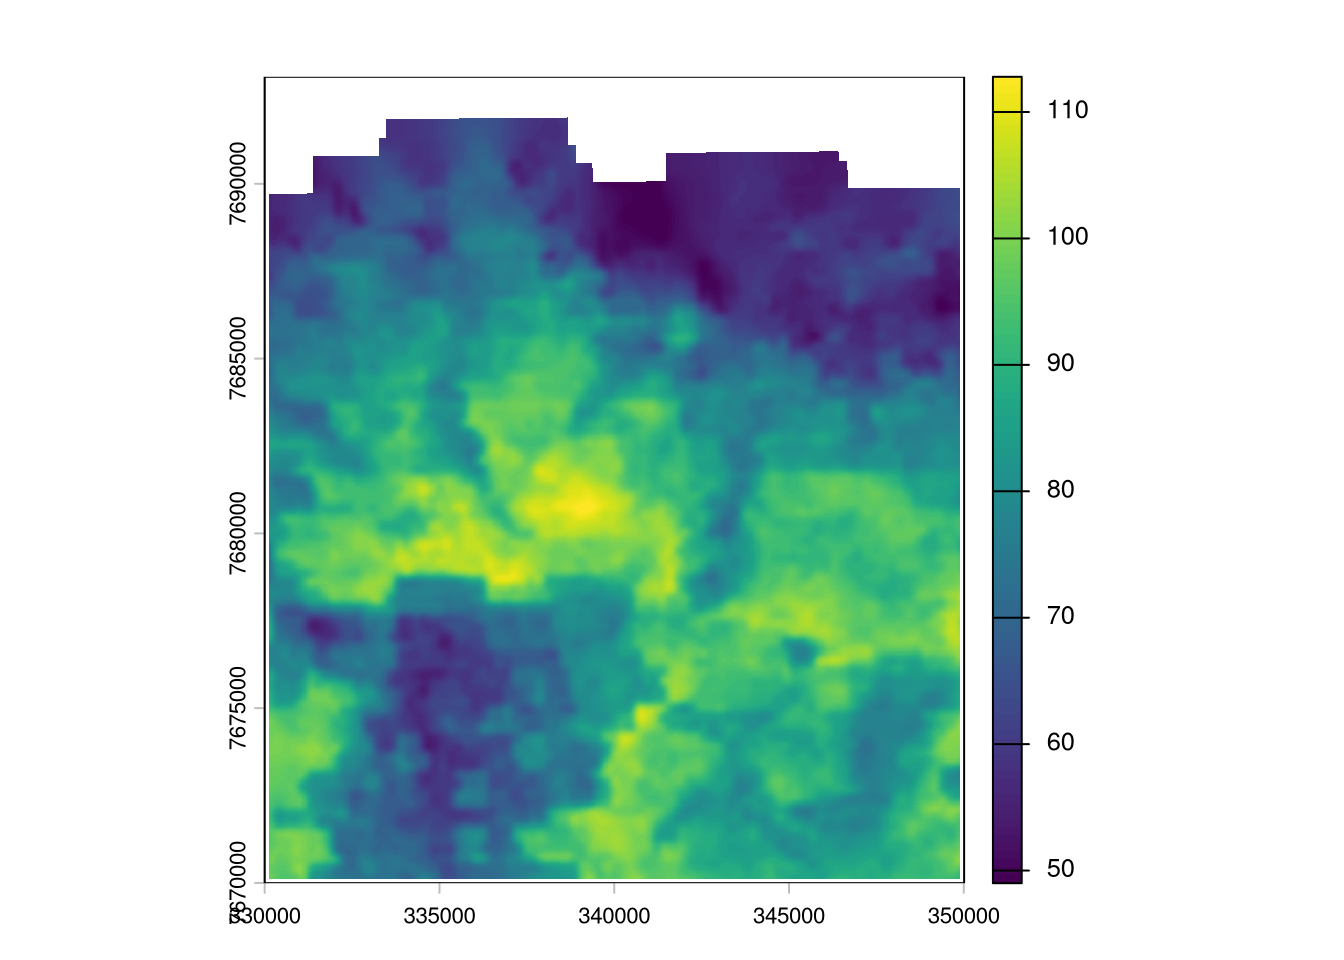
Prepare response data
library(ranger)
library(ggplot2)

l.rast <- list.files("datasets/lareunion/data/terrain/", pattern = ".tif$", full.names = T)
r.stack <- rast(l.rast)

v.samples <- st_read("datasets/lareunion/results/fsc_design_150.gpkg")
Reading layer `fsc_design_150' from data source
`/home/nussbaum/repos-uu/spatialstats-web/course-website/datasets/lareunion/results/fsc_design_150.gpkg'
using driver `GPKG'
Simple feature collection with 150 features and 1 field
Geometry type: POINT
Dimension: XY
Bounding box: xmin: 330675 ymin: 7671147 xmax: 349335 ymax: 7689387
Projected CRS: WGS 84 / UTM zone 40S# read response value
# (in a real project, we would read the values from the lab measured on soil samples)
d.SOCstock <- extract(r.soc, v.samples)
str(d.SOCstock)'data.frame': 150 obs. of 2 variables:
$ ID : num 1 2 3 4 5 6 7 8 9 10 ...
$ soilgrids_SOCstock_0-30_mean30mSmooth: num 76.2 79.4 68.7 80.6 88.2 ...Prepare predictor data
# read predictor values at sampling locations
d.predictors <- extract(r.stack, v.samples)

str(d.predictors)
'data.frame': 150 obs. of 35 variables:
$ ID : num 1 2 3 4 5 6 7 8 9 10 ...
$ asp_eness30m : num -0.948 0.167 -0.273 -0.988 0.372 ...
$ asp_nness30m : num -0.2546 0.982 0.953 0.0444 0.9281 ...
$ curv100m : num 0.00702 0.00803 -0.00431 -0.00452 0.00263 ...
$ curv30m : num 0.009431 0.019959 -0.022337 -0.029317 0.000387 ...
$ curvplan100m : num 0.000514 0.003546 -0.026976 -0.001553 0.005157 ...
$ curvplan30m : num -0.01869 0.02169 0.008 -0.00652 -0.00581 ...
$ curvprof100m : num 0.002752 0.000615 -0.000834 -0.000241 -0.000348 ...
$ curvprof30m : num 0.007082 -0.001764 -0.011551 -0.000702 0.001665 ...
$ heignor100m : num 0.939 0.695 0.112 0.407 0.918 ...
$ heignor30m : num 0.9834 0.8409 0.0765 0.2528 0.8918 ...
$ heigslope100m : num 724.8 161.9 26.6 267.7 403.3 ...
$ heigslope30m : num 812.9 174.1 13.6 139.7 346.3 ...
$ heigstand100m : num 1887.2 612.9 15.2 625.9 987.7 ...
$ heigstand30m : num 1991.43 744.34 6.94 378.71 960.64 ...
$ heigval100m : num 46.1 69.4 212.7 389.6 35 ...
$ heigval30m : num 13.7 32.9 164 412.8 42 ...
$ mpi100m_150 : num 0.0669 0.1218 0.1837 0.3102 0.0799 ...
$ mpi30m_150 : num 0.0173 0.144 0.2481 0.528 0.1072 ...
$ mrrtf100m : num 8.22e-02 3.26e-10 2.58e-07 4.70e-14 4.74e-06 ...
$ mrrtf30m : num 1.92e-03 2.46e-10 6.74e-09 2.22e-16 6.11e-05 ...
$ mrvbf100m : num 3.01e-04 1.14e-11 4.12e-03 1.12e-12 5.24e-08 ...
$ mrvbf30m : num 3.09e-05 2.17e-11 1.62e-06 2.91e-14 6.56e-05 ...
$ reunion_30m : num 2025 886 134 1508 1078 ...
$ slope100m-perc : num 0.403 0.64 0.265 0.8 0.356 ...
$ slope30m-perc : num 0.137 0.531 0.373 1.001 0.282 ...
$ tpi_270m : num 28.45 27.66 -23.75 -33.43 7.11 ...
$ tpi_900m : num 96.1 68.9 -50.4 -36.4 83.4 ...
$ tri100m : num 182 141 69 251 147 ...
$ tri30m : num 52.4 65.4 39.3 83.2 30.6 ...
$ TWIsaga100m_s100: num 6.94 6.11 9.45 6.86 6.22 ...
$ TWIsaga100m : num 6.74 5.61 10.01 7.16 6.24 ...
$ TWIsaga30m : num 6.44 4.63 10.88 7.45 6.79 ...
$ vrm100m : num 0.0868 0.116 0.0424 0.087 0.1374 ...
$ vrm30m : num 0.0868 0.0627 0.1038 0.0644 0.0365 ...Fit random forest
Quick and dirty random forest model fit.
## fit RF model
m.rf <- ranger(y = d.SOCstock$`soilgrids_SOCstock_0-30_mean30mSmooth`,
               x = d.predictors[,-c(1)], # do not use ID
               importance ="permutation")
m.rf
Ranger result
Call:
ranger(y = d.SOCstock$`soilgrids_SOCstock_0-30_mean30mSmooth`, x = d.predictors[, -c(1)], importance = "permutation")
Type: Regression
Number of trees: 500
Sample size: 150
Number of independent variables: 34
Mtry: 5
Target node size: 5
Variable importance mode: permutation
Splitrule: variance
OOB prediction error (MSE): 77.93772
R squared (OOB): 0.5437146 Predictor importance
t.importance <- importance(m.rf)

par(oma = c(2,10,2,2))
barplot(t.importance[order(t.importance)], horiz= T, las = 1, cex.names = 0.6)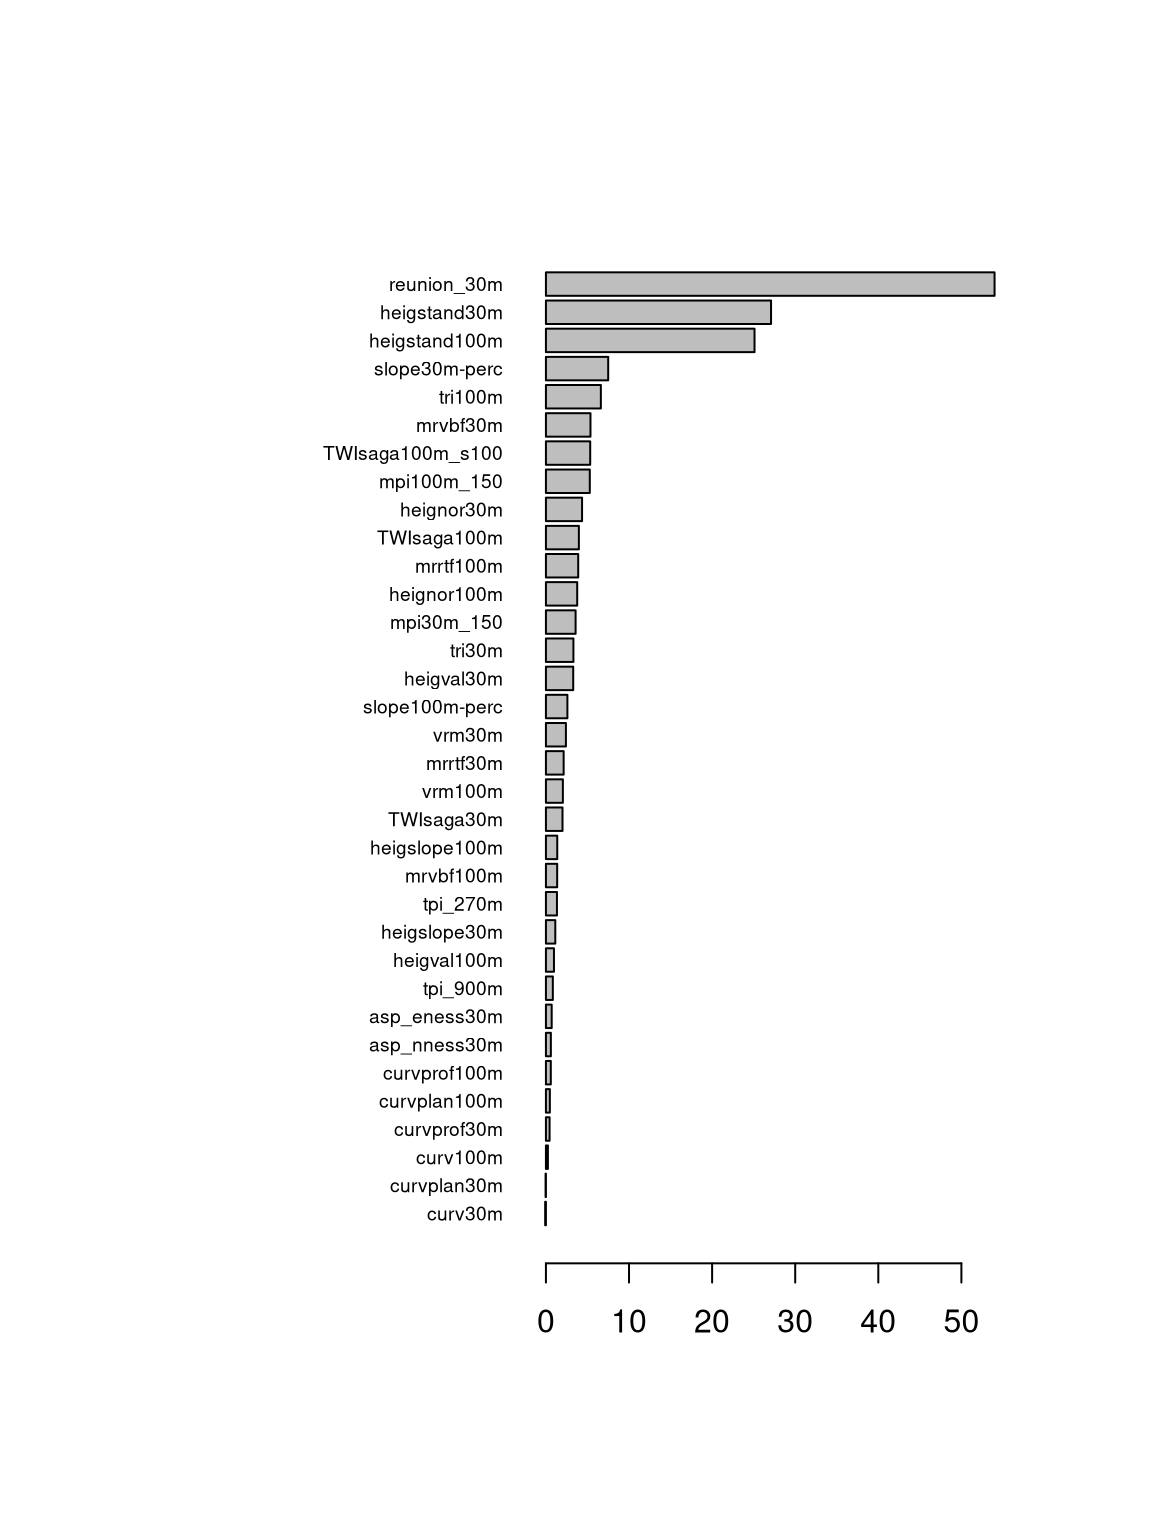
Evaluate map accuracy
Predict on validation sample
## Compute validation stats
v.validation <- st_read("datasets/lareunion/results/strs_design_30.gpkg")
Reading layer `strs_design_30' from data source
`/home/nussbaum/repos-uu/spatialstats-web/course-website/datasets/lareunion/results/strs_design_30.gpkg'
using driver `GPKG'
Simple feature collection with 30 features and 1 field
Geometry type: POINT
Dimension: XY
Bounding box: xmin: 330375 ymin: 7670487 xmax: 349095 ymax: 7688847
Projected CRS: WGS 84 / UTM zone 40Sd.predictors.val <- extract(r.stack, v.validation)
d.SOCstock.val <- extract(r.soc, v.validation)
d.SOCstock.val$predictions <- predict(m.rf, d.predictors.val)$prediction
summary(d.SOCstock.val$predictions) Min. 1st Qu. Median Mean 3rd Qu. Max.
55.82 74.61 80.41 80.40 88.60 91.93 Validation statistics
# compute marginal bias (positive values: overestimation, negative values: underestimation)
error <- d.SOCstock.val$`soilgrids_SOCstock_0-30_mean30mSmooth` - d.SOCstock.val$predictions
mean(-error)
[1] -1.942238# RMSE
sqrt(mean(error^2))[1] 6.949492# R2, computed as skill score / model efficiency coefficient
obs <- d.SOCstock.val$`soilgrids_SOCstock_0-30_mean30mSmooth`
1 - ( sum( error^2 ) / sum( (obs - mean(obs))^2 ) )[1] 0.711062Validation scatterplot
library(ggplot2)
ggplot(d.SOCstock.val, aes(predictions, `soilgrids_SOCstock_0-30_mean30mSmooth`)) +
  geom_point(size = 2) + ylim(52,108) + xlim(52,108) +
  xlab(expression("predicted SOC stocks [t" ~ha^-1~"]")) +
  ylab(expression("observed SOC stocks [t" ~ha^-1~"]")) +
  stat_smooth(se = FALSE, span = 1.5) +
  geom_abline (slope=1, linetype = "dashed", color="black") +
  theme_minimal()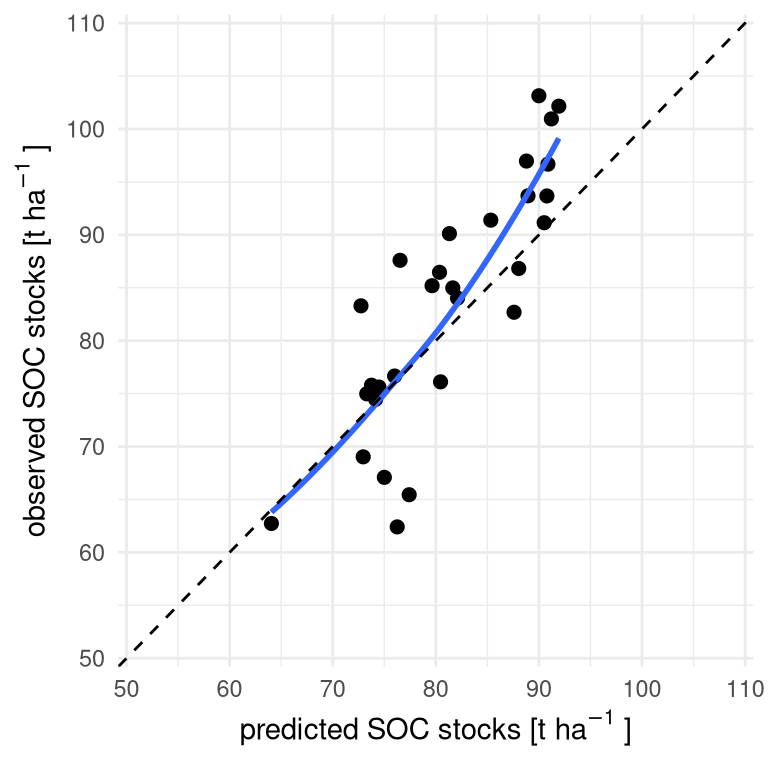
Create spatial predictions
# create a data frame, each row corresponds to a pixel
d.pixels <- as.data.frame(r.stack, xy = T, na.rm = F)

# remove NA
d.pixels <- d.pixels[ complete.cases(d.pixels), ]

# check if we have all predictors, list missing columns
names(importance(m.rf))[ !names(importance(m.rf)) %in% names(d.pixels) ]character(0)# predict using ranger object
d.pixels$SOCstock_predictions <- predict(m.rf, d.pixels)$predictions
# create a raster object and save
r.pred <- rast(d.pixels[, c("x", "y", "SOCstock_predictions")], type="xyz", crs= "epsg:32740")
writeRaster(r.pred, filename = "datasets/lareunion/results/predicted_SOC_stocks.tif", overwrite = T)Display results
plot(r.pred)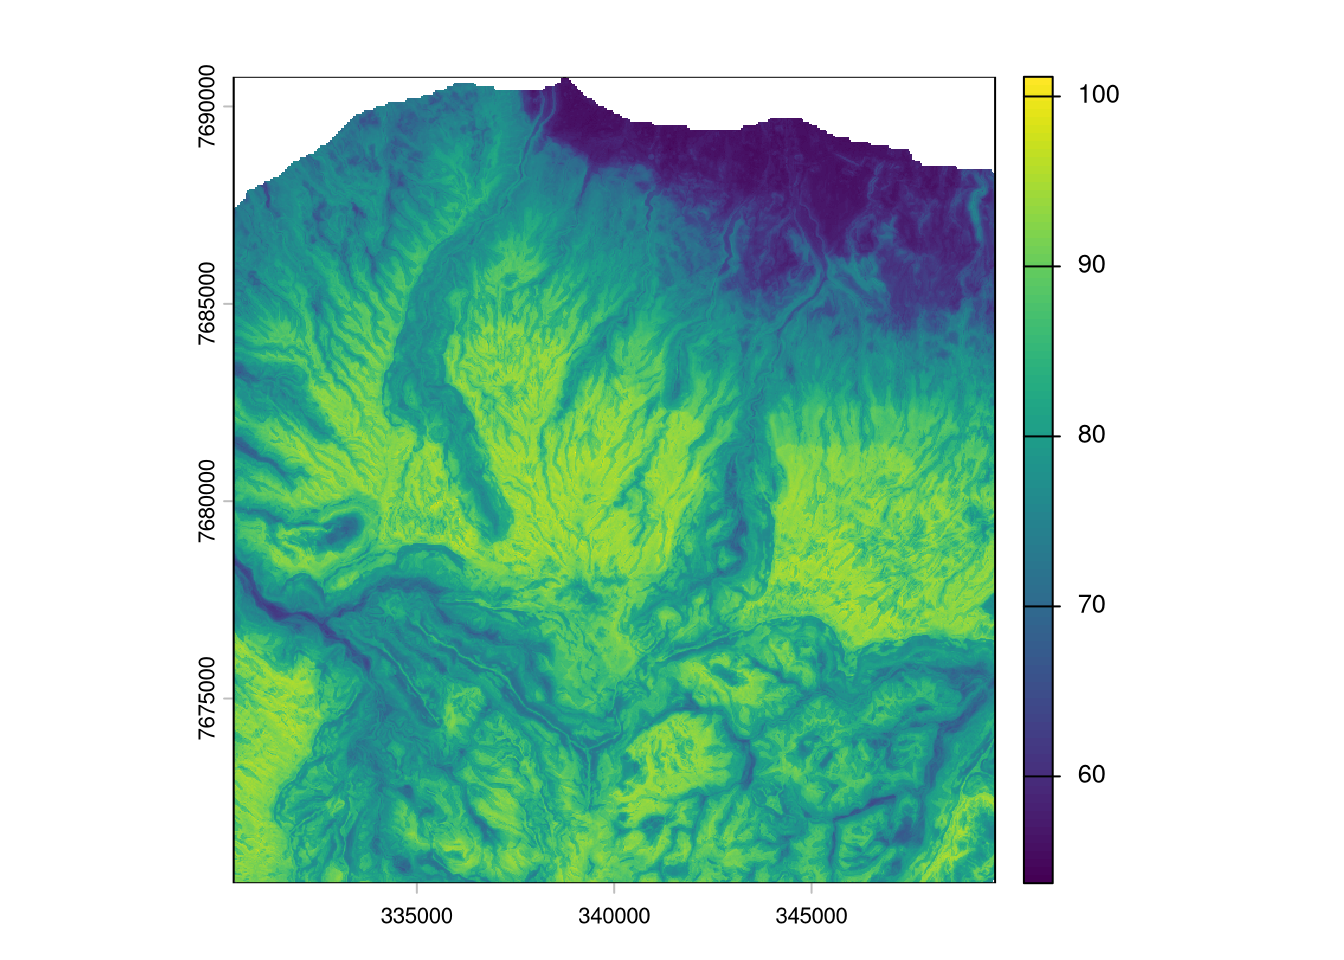
Tasks
TipTask 1
Compare the created map to the soil organic carbon stock map from SoilGrids. How well do they align? Where are major differences? And which map would you trust more as an end-user?